A defect cost ledger is a cross-functional view of the work triggered by enrollment defects. It’s a shared model, often maintained in a spreadsheet or analytics workspace, that connects defect types to the operational touches they create.
Think of it as a bridge between operational reality and financial language. It helps leaders decide where to invest by showing the total cost of rework, not just the cost of the first fix.
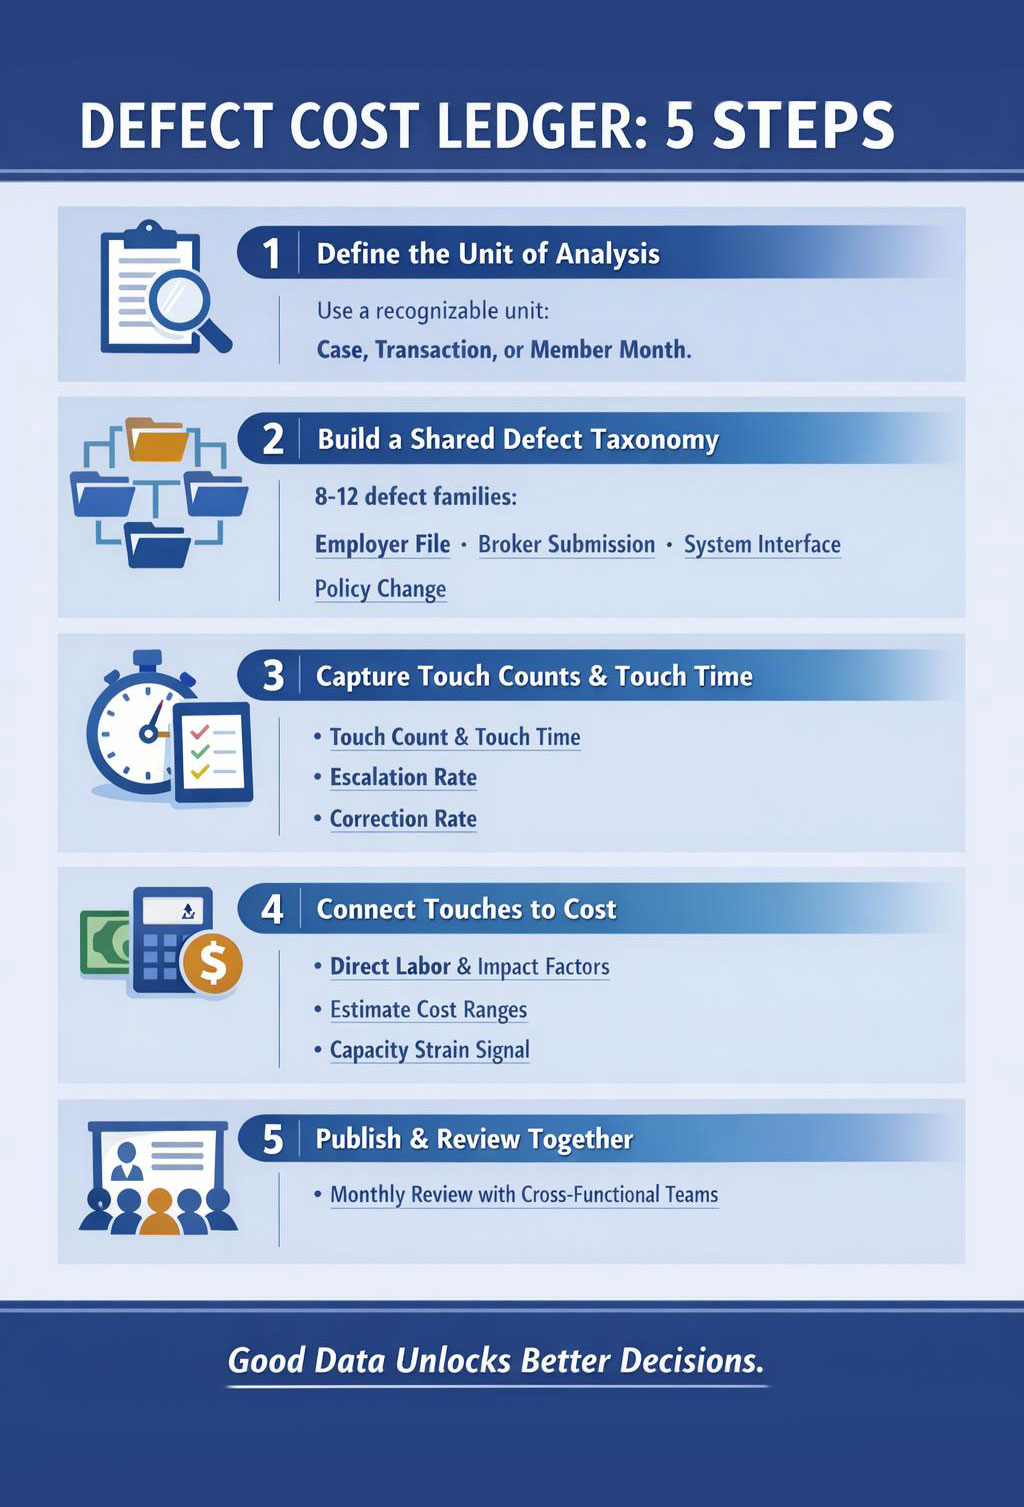
Step 1: Define the unit of analysis
Pick a unit that your teams can recognize and track. Common options include a case, a transaction, or a member month. Member month is a common unit in payer operations, meaning one member enrolled for one month, but you can use simpler units if your reporting is limited.
Step 2: Build a shared defect taxonomy
Start with 8 to 12 defect families. Use operational language. Avoid technical codes that only one team understands. Map each family to common sources, employer file, broker submission, internal maintenance, system interface, or policy change.
Step 3: Capture touch counts and touch time
For each defect family, estimate:
- Touch count: how many work touches typically occur end to end.
- Touch time: average minutes per touch, by function.
- Escalation rate: how often it becomes a supervisor case, grievance, or employer escalation.
- Downstream correction rate: how often it triggers claim adjustment, billing correction, or retroactive change.
If you have time tracking and case tags, use them. If you don’t, use structured sampling. A two week sample of tagged contacts and claim pend reasons can be enough to estimate ranges.
Cost modeling is often treated as a finance exercise that requires perfect data before it begins.
In our experience working with payer operations, the fastest progress comes from pairing finance with frontline leaders to create a good enough ledger, then improving precision over time as tagging and data quality mature.
You don’t need perfect data to start. You can unlock investment decisions with directional clarity, then refine the model as controls take hold.
Step 4: Connect touches to cost without overpromising
Estimate cost by multiplying touch time by volume, then applying a downstream impact factor where appropriate. Keep it simple and transparent.
- Direct labor estimate: average minutes per touch times loaded labor rate, if available, or relative effort if not.
- Downstream impact factor: a multiplier for work that creates reprocessing, rework loops, or provider abrasion.
- Capacity strain signal: a qualitative tag for peak season risk, for example open enrollment or group renewals.
The output should be a range. Ranges are more honest and still actionable.
Step 5: Publish a cross functional view and use it
The ledger only matters if it becomes a shared language. Review it monthly with enrollment, customer service, claims, billing, employer operations, and data leaders. Identify the top recurring defect families by total enterprise cost, not by enrollment backlog.
When leaders see the same defect through one ledger, prioritization stops being a debate and starts being a decision.


Share